- DATE:
- AUTHOR:
- Product Team @ Ethico
New Year, New Improvements: Introducing Custom Chart Builder 📊
We’re thrilled to kick off the year with some exciting enhancements designed to empower you with accessible reports and actionable insights. These updates aim to provide greater visibility into trends and information, helping you make well-informed decisions.
ecoReport Enhancements
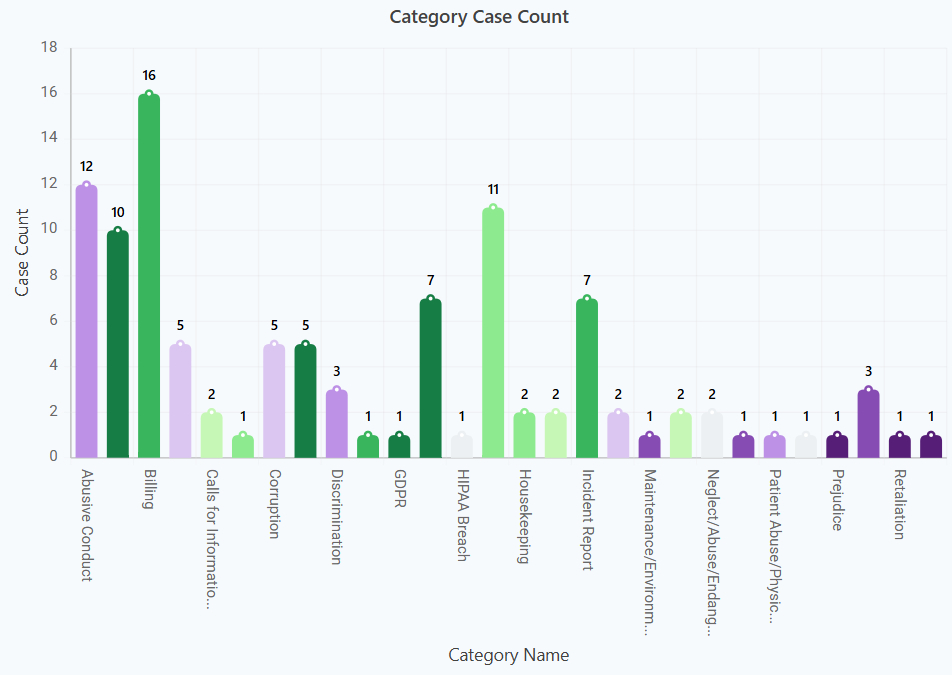
Introducing the Custom Chart Builder
As part of our Custom Reports, we’re launching a brand-new feature, Custom Chart Builder. This innovative tool allows you to create custom charts and visualizations that represent your data in ways most meaningful to you.
For those familiar with ecoReports, this enhancement enables you to go beyond the default charts available in the prebuilt library. You’ll automatically gain access to a variety of standard graph options that complement your raw data, providing deeper insights.
This is just the beginning! We plan to expand Chart Builder with more features and functionality over the few releases, and your feedback is essential as we scope out the future enhancements. Please explore the new Chart Builder and share your thoughts using the Feedback section in the upper left corner of the page. If you need assistance accessing this feature, contact us at customersuccess@ethico.com, and our team will gladly help you get started.
Watch a demo of this new feature 

Enhanced Question Reportability
We’ve modified question reportability capabilities by altering the current data structure. This improved data table offers a streamlined structure, making question/response outputs easier to interpret. With high-level aggregated results placed at the bottom of the table, users can now quickly view summaries at a glance, enabling faster analysis. As we finalize the necessary changes to the Custom Chart Builder in the upcoming months, we will be incorporating the capability to create a visualization of your questions/responses in bulk right from the application. In the meantime, the new structured data makes it easier to build your own reports outside of the application by simply exporting the data.

Campaign Manager Updates
Participant Details
Our Campaign Manager module now includes a newly added view, Participant Details, providing a detailed breakdown of participant activity and involvement across different campaigns and time periods. This feature allows you to drill down into participant-specific information, making it easier to track engagement and participation metrics effectively.
Watch a demo of this new feature

Explore ecoBot Integrations
Last but not least, have you explored the many ways our ecoBot integrations can streamline your workflow with the case management system or web reporting for your employees? Our latest tools are designed to enhance efficiency and accessibility:
Policy Review ecoBot: Configured on an account-by-account basis, this feature centralizes your most critical reference materials and policies within the case management system. This reduces time spent searching for material outside the application, promoting efficiency during investigations.
ecoBot Ivy: Install this tool on your intranet or employee portals to make incident reporting more accessible to your broader employee population for incident reporting.
Get in touch with us to learn more about these integrations, and let us help you optimize your experience with our tools.
Click the images to view the recorded demos 
